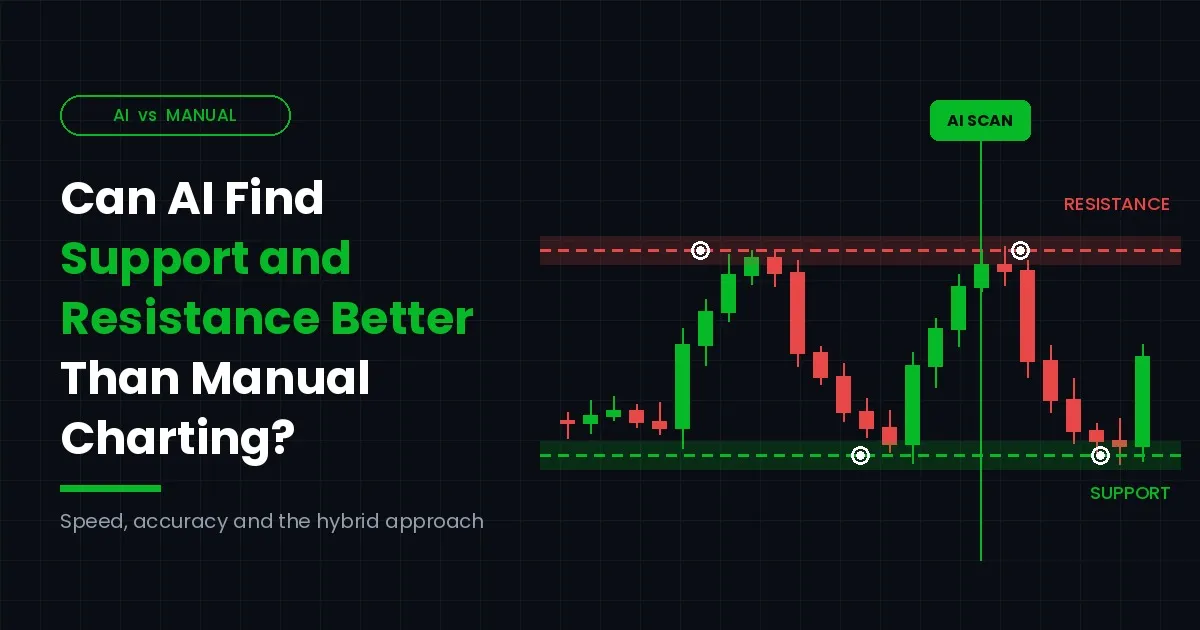
Every trader eventually asks the same question. Where will price stop, and where will it turn? For decades, the answer has come from support and resistance. These levels sit at the heart of technical analysis. They guide entries, exits, and risk on almost every chart.
However, the way traders find these levels is changing. Artificial intelligence now scans thousands of candles in seconds. Meanwhile, many experienced traders still trust a trained eye and years of screen time. So, which approach actually works better?
In this guide, we compare both methods honestly. You will learn how each one works, where each one fails, and how to blend them into a practical routine.
What Are Support and Resistance Levels?
Support is a price zone where buying pressure tends to halt a decline. Resistance is the opposite. It is a zone where selling pressure tends to cap a rally.
These zones form because traders remember prices. For example, if a stock bounced hard from $50 three times, buyers often step in again near $50. Likewise, sellers who missed an exit at $70 may sell quickly when price returns there.
In other words, support and resistance reflect crowd psychology. They are not magic lines. Instead, they are areas where supply and demand shifted before and may shift again.
It is also worth noting that these levels are zones, not exact prices. Price often pierces a level slightly before reversing. As a result, rigid thinking about exact numbers leads to many false signals.
Why Support and Resistance Still Matter Today
Some traders argue that algorithms have made classic chart levels outdated. In reality, the opposite is often true. Many trading algorithms are themselves programmed around support and resistance, so these zones can become even more influential.
Institutional traders also place large orders near well-known levels. This concentration of orders creates the very reactions that chartists look for. Consequently, understanding support and resistance remains a core skill, whether you draw lines yourself or rely on software.
Furthermore, these levels give every trade a clear structure. They tell you where to enter, where you are wrong, and where to take profit. Without that framework, decisions tend to become emotional and random.
How to Identify Support and Resistance Levels Manually
Before judging AI, it helps to understand the traditional craft. Here is how to identify support and resistance levels the manual way.
Start With Higher Timeframes
Most seasoned chartists begin on weekly or daily charts. Levels on higher timeframes carry more weight because more capital traded there. Then, they zoom in to refine entries on lower timeframes.
Mark Swing Highs and Swing Lows
Next, traders mark obvious turning points. A swing high is a peak with lower highs on both sides. A swing low is a trough with higher lows around it. When several swings cluster near one price, a strong zone usually exists.
Look for Role Reversal
Broken resistance often becomes support, and broken support often becomes resistance. This “flip” is one of the most reliable patterns in charting. Therefore, manual analysts watch closely for retests after a breakout.
Add Volume and Context
Finally, volume confirms conviction. A level that formed on heavy volume tends to matter more. Round numbers, prior gaps, and moving averages can add extra confluence too.
Done well, this process is powerful. Still, it is slow, and the results depend heavily on the person drawing the lines.
How AI Detects Support and Resistance
AI tools approach the same problem from a different angle. Rather than eyeballing a chart, they process raw price and volume data mathematically.
Pattern Recognition at Scale
Machine learning models can review years of data across hundreds of markets at once. They find price areas where reversals happened again and again. Some use clustering algorithms, which group nearby swing points into dense zones.
Volume Profile and Order Flow
Many tools also analyze how much volume traded at each price. High-volume nodes often act as magnets or barriers. Some advanced systems even study order book depth in real time, although that data is not available in every market.
Probability Scoring
Better AI models do not just draw lines. They also assign a strength score to each zone. For instance, a level touched five times on heavy volume might score higher than a level touched once.
Continuous Updating
Markets evolve constantly. Consequently, AI tools recalculate support and resistance as new candles print. A manual trader, by contrast, must remember to revisit and redraw old lines. This matters because a level that held last month may carry little weight today. Fresh data keeps your map of support and resistance current and relevant.
AI vs Manual Charting: An Honest Comparison
Now let’s compare the two methods across the factors that matter most to active traders.
Speed and Coverage
AI wins clearly here. A human might analyze ten charts carefully in an hour. An algorithm can analyze thousands in minutes. If you trade many instruments, this advantage is hard to ignore.
Consistency and Objectivity
Manual charting is subjective. Two skilled traders can look at the same chart and draw different levels. Moreover, emotions creep in. A trader holding a long position may “see” support that is not really there.
AI applies the same rules every time. It does not get tired, hopeful, or afraid. As a result, its output is more consistent, even if it is not always correct.
Context and Judgment
Here, humans still hold an edge. A trader understands that an earnings report, a central bank meeting, or breaking news can make any level irrelevant. Most AI tools focus only on price data, so they may miss these fundamental shifts.
Humans also recognize nuance. For example, an experienced trader can tell when a level feels “tired” after repeated tests. While some models attempt this, judgment of this kind remains difficult to code.
Accuracy in Real Markets
Accuracy depends on the quality of the tool and the skill of the trader. A well-designed AI model often beats a beginner’s hand-drawn lines. However, an expert’s support and resistance zones may match or outperform a poorly built algorithm.
In addition, AI can suffer from overfitting. This happens when a model learns past noise rather than real patterns. Such a model looks impressive on historical data but struggles with live prices.
The Learning Curve
Manual charting takes years to master. On the other hand, AI tools deliver usable levels immediately. That said, relying entirely on automation can stop newer traders from building real chart-reading skills.
Common Mistakes With Both Approaches
Neither method is foolproof. Below are the errors I see most often after many years of reviewing trader journals:
- Drawing too many lines. A cluttered chart creates confusion, not clarity. Focus on the few zones that truly matter.
- Treating levels as exact prices. Always think in zones, and allow for small overshoots.
- Trusting AI blindly. Every algorithm has blind spots, so verify its levels against the chart.
- Ignoring the trend. Support in a strong downtrend breaks far more often than support in an uptrend.
- Skipping risk management. Even the strongest level can fail, so a stop-loss remains essential.
Building a Hybrid Support and Resistance Trading Strategy
In practice, the best results usually come from combining both methods. A hybrid support and resistance trading strategy uses AI for speed and humans for judgment. Here is a simple framework.
Step 1: Let AI Scan the Market
First, use an AI tool to scan your watchlist. Let it highlight the strongest zones and flag charts where price is nearing a key level. This saves hours of manual searching.
Step 2: Validate on the Chart
Next, open each flagged chart yourself. Check whether the zone aligns with obvious swing points, volume spikes, and higher-timeframe structure. If it does not make visual sense, be cautious.
Step 3: Check the Broader Context
Then, look at the economic calendar and the news. Is an earnings release or an interest rate decision coming? If so, consider waiting until the event passes.
Step 4: Wait for Confirmation
Never trade a level just because it exists. Instead, wait for price action to confirm it. A rejection candle, a volume surge, or a clean retest after a breakout all provide useful evidence.
Step 5: Define Risk Before Entry
Finally, place your stop beyond the zone, not inside it. Size your position so that a single loss cannot seriously damage your account. A sound support and resistance trading strategy always puts capital protection first.
Who Benefits Most From AI Level Detection?
Different traders gain different value from automation.
Day traders and scalpers benefit hugely from speed. Levels shift quickly on short timeframes, and AI keeps up better than any human.
Swing traders gain from broader coverage. They can scan many markets each evening and shortlist only the best setups.
Long-term investors may need AI the least. Weekly and monthly levels change slowly, so manual analysis is usually manageable.
Beginners, meanwhile, should use AI as a teacher rather than a crutch. Compare the tool’s levels with your own drawings. Over time, you will learn how to identify support and resistance levels on your own. You will also start to see where the algorithm is right or wrong.
The Verdict: Can AI Do It Better?
So, can AI find support and resistance levels better than manual charting? The honest answer is that it depends on what “better” means.
AI is faster, more consistent, and more objective. It covers more markets and never gets emotional. For many traders, those strengths alone are a major upgrade.
Yet AI is not a replacement for understanding. It lacks full market context, and unusual conditions can fool it. Human judgment still adds real value, especially around news events and changing trends.
Ultimately, the strongest approach is collaborative. Let the machine do the heavy lifting, and let your experience make the final call.
Final Thoughts
Above all, treat your trading like a business rather than a hobby. Every successful business tracks costs, reviews results, and improves its processes over time. Similarly, keep a journal of every trade you take at a key level. Note whether the zone came from AI, manual analysis, or both. After a few months, your own data will reveal which approach suits your style best.
Many traders exploring AI-driven charting tools come across platforms such as GainzAlgo, which offers algorithmic signals for TradingView users. Before relying on any tool like this, it makes sense to research common questions such as “is gainzalgo legit” by reading independent reviews, checking its track record, and testing it on a demo account first. Whichever indicator you choose, treat its levels as one input for your own analysis, never as a guaranteed outcome.